The source code for the plot_AC_coupling_graphs function is available in my Jupyter Github repository.
R=50kΩ, C=1µF, f=20Hz
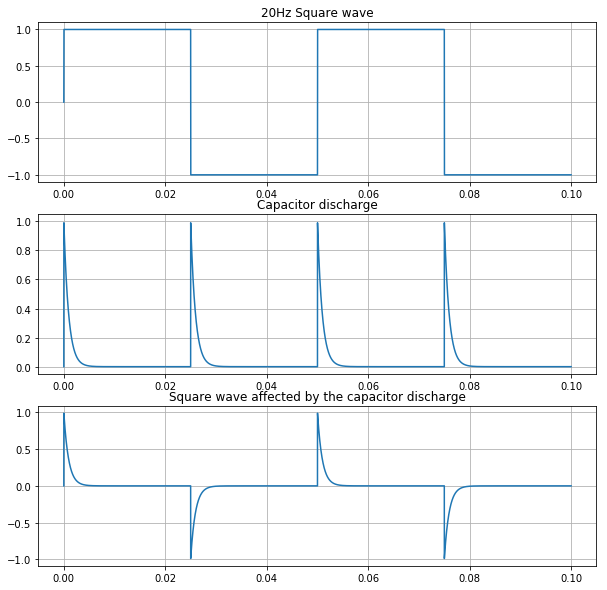
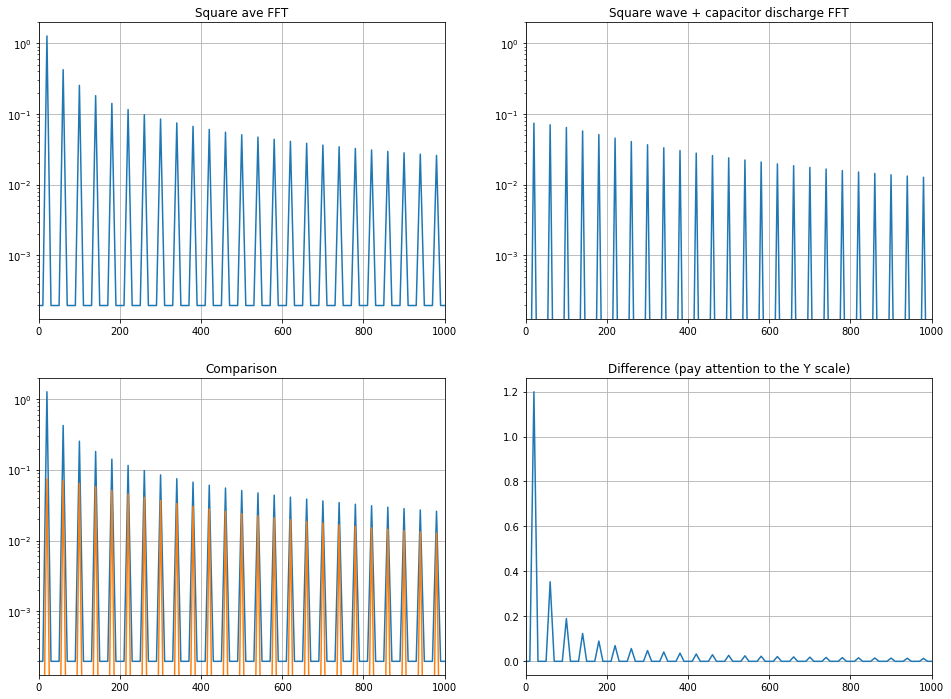
plot_AC_coupling_graphs(R=50.0e3, C=1.0e-6, a=1, f=20, periods=2)
Cutoff frequency = 3.183099 Hz
R=200Ω, C=4.7µF, f=20Hz
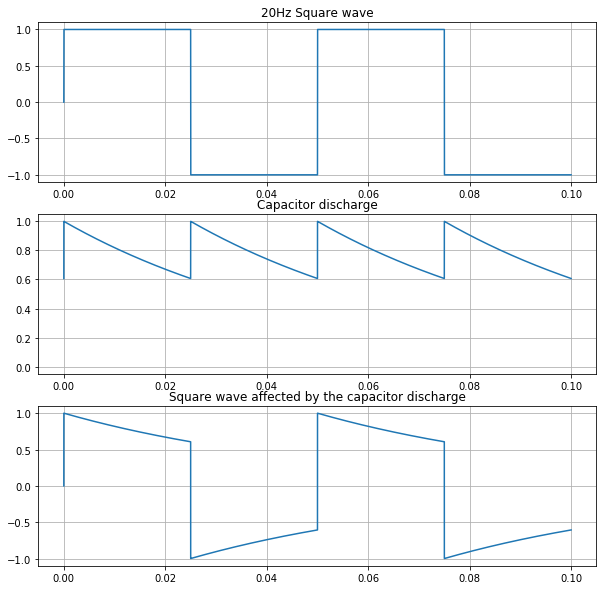
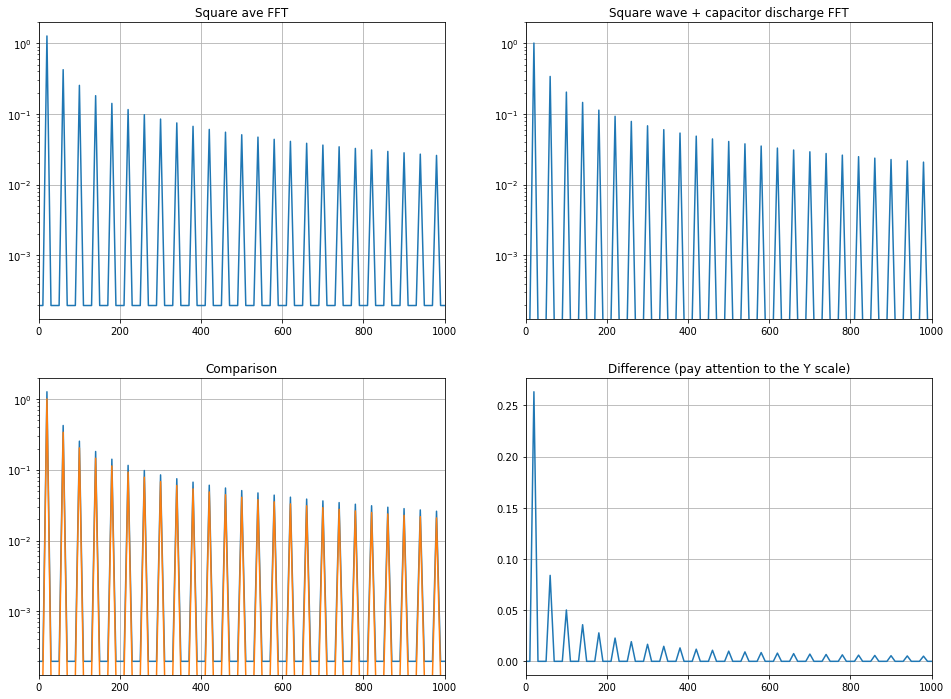
plot_AC_coupling_graphs(R=200.0, C=4.7e-6, a=1, f=20, periods=2)
Cutoff frequency = 169.313769 Hz